Groups Classification Based on the Production Efficiency Index (PEI)
Print
Modified on: Tue, 7 Apr, 2026 at 9:15 AM
What is the PEI?
The PEI (Production Efficiency Index) is an indicator that measures the productive efficiency
achieved during the raising of a grouP.
It can be use as a general indicator of farm efficiency, acting as a "thermometer" for group
performance. It is a comprehensive metric that brings together different production factors to
represent the overall result of the group
This index combines ADG (Average Daily Gain), FCR (Feed Conversion Rate), and mortality
into a single value, making it easier to compare performance between groups quickly and
practically. The higher the PEI, the better the production performance of the group. This
metric provides a comprehensive view of efficiency by integrating multiple data points,
moving beyond the limitations of isolated indicators.
Where can I view the groups rankings?
Rankings are available for both nursery and finishing phases.
To access them in S4, navigate to:
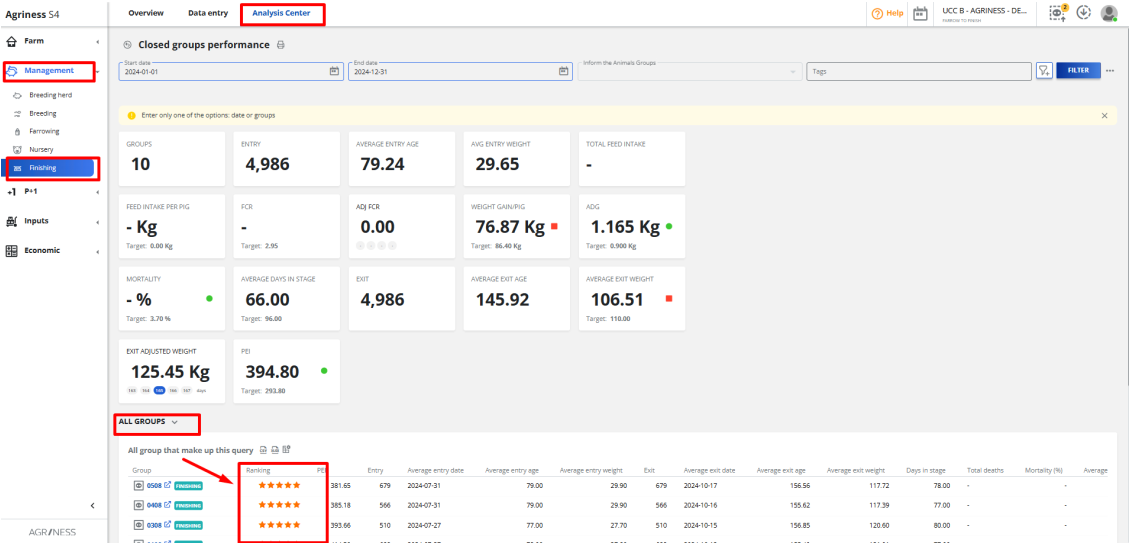
Management > Nursery or Finishing > Analysis Center > Closed groups performance
On the Closed Groupes Performance report screen, scroll to the bottom of the page. You will
find the “All groups” section, which lists every group included in your query.
In this list, the second column displays the ranking for each group

How does the ranking work?
The ranking classifies groups by comparing their actual PEI against the farm's PEI Target.Each group is evaluated based on a custom PEI target that reflects your farm’s specific performance standards.
The performance is divided into five levels, represented in the report by a 5-star rating:
Excellent (Level 5) (*****)When the group's PEI is 15% or more above the target.Example: Target = 300 → PEI ≥ 345
Very Good (Level 4) (****)When the PEI is between 6% and 15% above the target.Example: Target = 300 → PEI between 318 and 344
Adequate (Level 3) (***)When the PEI is within ±5% of the target (meeting expectations). Example: Target = 300 → PEI between 285 and 315
Low (Level 2) (**)When the PEI is between 6% and 15% below the target.Example: Target = 300 → PEI between 255 and 282
Critical (Level 1) (*)When the PEI is 15% or more below the target.Example: Target = 300 → PEI ≤ 255
How to use?● Internal Group Ranking: Compare performance across different groups within thesame company.● Bonus Decisions: Determine payment bonuses based on group performance.● Benchmarking: Measure results against historical data or industry standards.
Practical Example● Farm Target: 300● Group PEI: 330
Calcule: (330 - 300) / 300 = 10% → Level 4 (Very Good)
How is the Group PEI calculated?
The PEI is calculated using the following formula: (ADG * (100 - %Mortality) / F.C) * 10The metrics used in this formula can be found under:Management > Nursery or Finishing > Analysis Center > Closed groups performance

Did you find it helpful?
Yes
No
Send feedback Sorry we couldn't be helpful. Help us improve this article with your feedback.